Data Format Guide
Basic data format
UpSetPlot can take a Pandas Series or DataFrame object with Multi-index as input. Each Set is a level in pandas.MultiIndex with boolean values.
Use Series as input
Below is a minimal example using Series as input:
[19]:
from upsetplot import generate_counts
example_counts = generate_counts()
example_counts
[19]:
cat0   cat1   cat2
False  False  False      56
              True      283
       True   False    1279
              True     5882
True   False  False      24
              True       90
       True   False     429
              True     1957
Name: value, dtype: int64
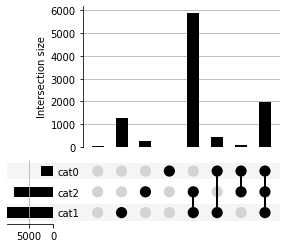
This is a pandas.Series with 3-level Multi-index. Each level is a Set: cat0, cat1, and cat2. Each row is a unique subset with boolean values in indices indicating memberships of each row. The value in each row indicates the number of observations in each subset. upsetplot will simply plot these numbers when supplied with a Series:
[20]:
from upsetplot import UpSet
plt = UpSet(example_counts).plot()
3 8 2
Alternatively, we can supply a Series with each observation in a row:
[3]:
from upsetplot import generate_samples
example_samples = generate_samples().value
example_samples
[3]:
cat0   cat1   cat2
False  True   True    1.652317
              True    1.510447
       False  True    1.584646
              True    1.279395
       True   True    2.338243
                        ...
              True    1.701618
              True    1.577837
True   True   True    1.757554
False  True   True    1.407799
True   True   True    1.709067
Name: value, Length: 10000, dtype: float64
In this case, we can use subset_size='count' to have upsetplot count the number of observations in each unique subset and plot them:
[21]:
from upsetplot import UpSet
plt = UpSet(example_samples, subset_size='count').plot()
3 8 2

Use DataFrame as input:
A DataFrame can also be used as input to carry additional information.
[5]:
from upsetplot import generate_samples
example_samples_df = generate_samples()
example_samples_df.head()
[5]:
| index | value | |||
|---|---|---|---|---|
| cat0 | cat1 | cat2 | ||
| False | True | True | 0 | 1.652317 |
| True | 1 | 1.510447 | ||
| False | True | 2 | 1.584646 | |
| True | 3 | 1.279395 | ||
| True | True | 4 | 2.338243 |
In this data frame, each observation has two variables: index and value. If we simply want to count the number of observations in each unique subset, we can use subset_size='count':
[22]:
from upsetplot import UpSet
plt = UpSet(example_samples_df, subset_size='count').plot()
3 8 2

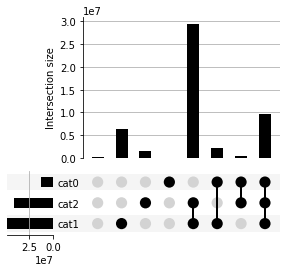
If for some reason, we want to plot the sum of a variable in each subset (eg. index), we can use sum_over='index'. This will make upsetplot to take sum of a given variable in each unique subset and plot that number:
[7]:
from upsetplot import UpSet
plt = UpSet(example_samples_df, sum_over='index', subset_size='sum').plot()
3 8 2
Convert Data to UpSet-compatible format
We can convert data from common formats to be compatible with upsetplot.
Suppose we have three sets:
[8]:
mammals = ['Cat', 'Dog', 'Horse', 'Sheep', 'Pig', 'Cattle', 'Rhinoceros', 'Moose']
herbivores = ['Horse', 'Sheep', 'Cattle', 'Moose', 'Rhinoceros']
domesticated = ['Dog', 'Chicken', 'Horse', 'Sheep', 'Pig', 'Cattle', 'Duck']
(mammals, herbivores, domesticated)
[8]:
(['Cat', 'Dog', 'Horse', 'Sheep', 'Pig', 'Cattle', 'Rhinoceros', 'Moose'],
 ['Horse', 'Sheep', 'Cattle', 'Moose', 'Rhinoceros'],
 ['Dog', 'Chicken', 'Horse', 'Sheep', 'Pig', 'Cattle', 'Duck'])
We can construct a data frame ready for plotting:
[9]:
import pandas as pd

# make a data frame for each set
mammal_df = pd.DataFrame({'mammal': True, 'Name': mammals})
herbivore_df = pd.DataFrame({'herbivore': True, 'Name': herbivores})
domesticated_df = pd.DataFrame({'domesticated': True, 'Name': domesticated})

# Merge three data frames together
animals_df = mammal_df.merge(
    herbivore_df.merge(domesticated_df, on = 'Name', how = 'outer'),
    on = 'Name', how = 'outer')

# Replace NaN with False
animals_df = animals_df.fillna(False)

# Make sets index for the data frame
animals_df = animals_df.set_index(['mammal', 'herbivore', 'domesticated'])

animals_df
[9]:
| Name | |||
|---|---|---|---|
| mammal | herbivore | domesticated | |
| True | False | False | Cat |
| True | Dog | ||
| True | True | Horse | |
| True | Sheep | ||
| False | True | Pig | |
| True | True | Cattle | |
| False | Rhinoceros | ||
| False | Moose | ||
| False | False | True | Chicken |
| True | Duck |
Now we can plot:
[10]:
from upsetplot import UpSet
plt = UpSet(animals_df, subset_size='count').plot()
3 5 2
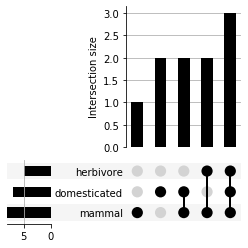
upsetplot actually provides a function from_contents to do this for you.from_contents takes a dictionary as input. The input dictionary should have set names as key and a list of set members as values:[11]:
from upsetplot import from_contents
animals_df = from_contents({'mammal': mammals, 'herbivore': herbivores, 'domesticated': domesticated})
animals_df
[11]:
| id | |||
|---|---|---|---|
| mammal | herbivore | domesticated | |
| True | False | False | Cat |
| True | Dog | ||
| True | True | Horse | |
| True | Sheep | ||
| False | True | Pig | |
| True | True | Cattle | |
| False | Rhinoceros | ||
| False | Moose | ||
| False | False | True | Chicken |
| True | Duck |
Converting any Data Frame to “UpSet-ready” format
Let’s take a look at the movies dataset used in the original publication by Alexander Lex et al. and UpSetR package.
[12]:
movies = pd.read_csv("../movies.csv")
movies.head()
[12]:
| Name | ReleaseDate | Action | Adventure | Children | Comedy | Crime | Documentary | Drama | Fantasy | ... | Horror | Musical | Mystery | Romance | SciFi | Thriller | War | Western | AvgRating | Watches | |
|---|---|---|---|---|---|---|---|---|---|---|---|---|---|---|---|---|---|---|---|---|---|
| 0 | Toy Story (1995) | 1995 | 0 | 0 | 1 | 1 | 0 | 0 | 0 | 0 | ... | 0 | 0 | 0 | 0 | 0 | 0 | 0 | 0 | 4.15 | 2077 |
| 1 | Jumanji (1995) | 1995 | 0 | 1 | 1 | 0 | 0 | 0 | 0 | 1 | ... | 0 | 0 | 0 | 0 | 0 | 0 | 0 | 0 | 3.20 | 701 |
| 2 | Grumpier Old Men (1995) | 1995 | 0 | 0 | 0 | 1 | 0 | 0 | 0 | 0 | ... | 0 | 0 | 0 | 1 | 0 | 0 | 0 | 0 | 3.02 | 478 |
| 3 | Waiting to Exhale (1995) | 1995 | 0 | 0 | 0 | 1 | 0 | 0 | 1 | 0 | ... | 0 | 0 | 0 | 0 | 0 | 0 | 0 | 0 | 2.73 | 170 |
| 4 | Father of the Bride Part II (1995) | 1995 | 0 | 0 | 0 | 1 | 0 | 0 | 0 | 0 | ... | 0 | 0 | 0 | 0 | 0 | 0 | 0 | 0 | 3.01 | 296 |
5 rows × 21 columns
In this table, each movie occupies a row with each column being a feature of the film. columns 3 to 19 records the genre each film belong in, with 1 indicating that the movie belongs to this genre.
Since upsetplot requires its set data be boolean values, we convert the numberical coding in this dataset to boolean values and set them as index:
[13]:
genres = list(movies.columns[2:len(movies.columns)-2])
movies_genre = movies[genres].astype(bool)
movies_genre = pd.concat([movies_genre,
                          movies[[col for col in movies.columns if col not in genres]]],
                         axis=1).set_index(genres)
movies_genre.head()
[13]:
| Name | ReleaseDate | AvgRating | Watches | |||||||||||||||||
|---|---|---|---|---|---|---|---|---|---|---|---|---|---|---|---|---|---|---|---|---|
| Action | Adventure | Children | Comedy | Crime | Documentary | Drama | Fantasy | Noir | Horror | Musical | Mystery | Romance | SciFi | Thriller | War | Western | ||||
| False | False | True | True | False | False | False | False | False | False | False | False | False | False | False | False | False | Toy Story (1995) | 1995 | 4.15 | 2077 |
| True | True | False | False | False | False | True | False | False | False | False | False | False | False | False | False | Jumanji (1995) | 1995 | 3.20 | 701 | |
| False | False | True | False | False | False | False | False | False | False | False | True | False | False | False | False | Grumpier Old Men (1995) | 1995 | 3.02 | 478 | |
| True | False | False | False | False | False | False | False | False | False | False | Waiting to Exhale (1995) | 1995 | 2.73 | 170 | ||||||
| False | False | False | False | False | False | False | False | False | False | False | Father of the Bride Part II (1995) | 1995 | 3.01 | 296 |
Now let’s plot!
[23]:
import upsetplot as upset
plt = upset.UpSet(movies_genre, subset_size='count').plot()
17 280 2

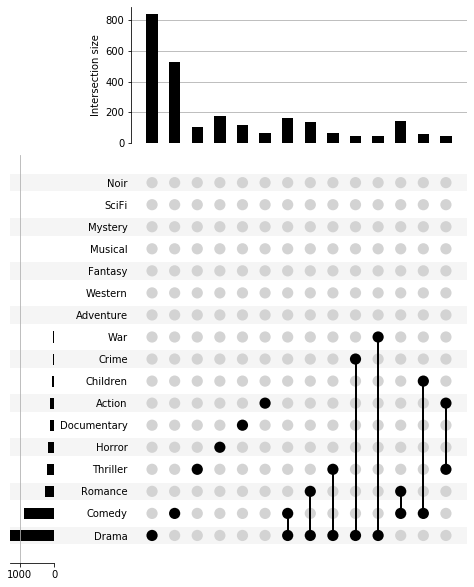
Above plot gives every single subset based on the input data. Since we have a 17-level multi-index, we are seeing \(2^{17}=131072\) possible subsets (although in this dataset we have only 280 total subsets). In cases like this, it can be helpful to set an observation threshold to exclude low-count subsets. This can be achieved by grouping data mannually and filter by counts:
[24]:
movies_genre_grouped = movies_genre.groupby(level=genres).count()
movies_genre_subset = movies_genre_grouped[movies_genre_grouped.Name > 40]
plt = upset.UpSet(movies_genre_subset.Name).plot()
17 14 2