Introductory examples for upsetplot.
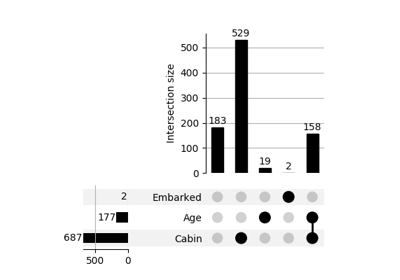
Plot the distribution of missing values
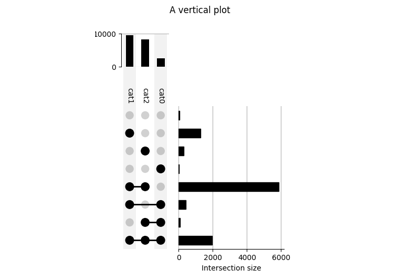
Vertical orientation
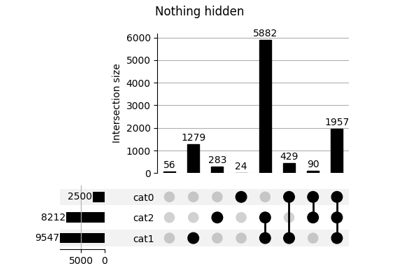
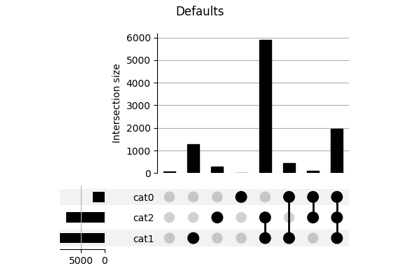
Plotting with generated data
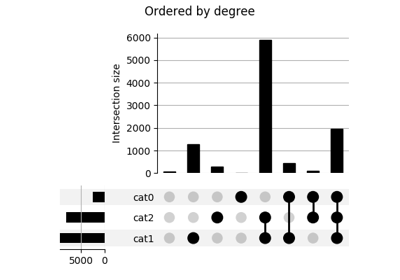
Hiding subsets based on size or degree
Customising element size and figure size
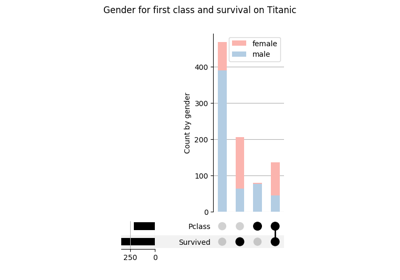
Plotting discrete variables as stacked bar charts
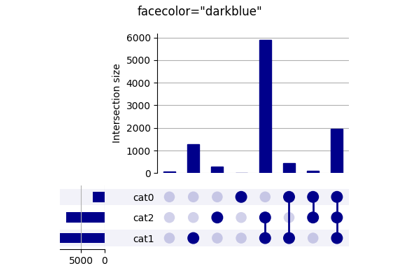
Changing Plot Colors
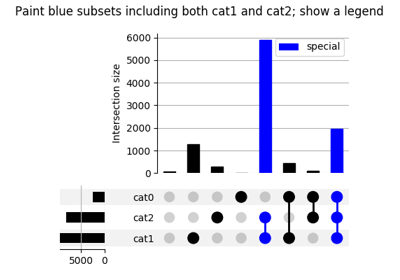
Highlighting selected subsets
Above-average features in Boston
Gallery generated by Sphinx-Gallery