Note
Click here to download the full example code
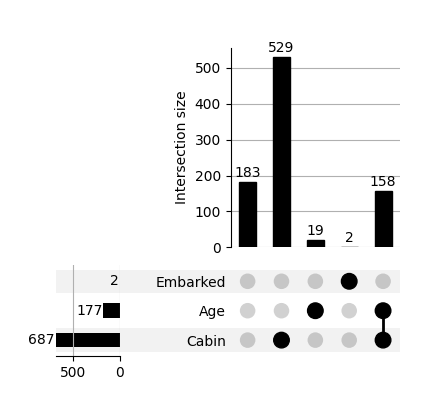
Plot the distribution of missing values
UpSet plots are often used to show which variables are missing together.
Passing a callable indicators=pd.isna to from_indicators() is
an easy way to categorise a record by the variables that are missing in it.
from matplotlib import pyplot as plt
import pandas as pd
from upsetplot import plot, from_indicators

TITANIC_URL = 'https://raw.githubusercontent.com/datasciencedojo/datasets/master/titanic.csv'  # noqa
data = pd.read_csv(TITANIC_URL)

plot(from_indicators(indicators=pd.isna, data=data), show_counts=True)
plt.show()
Total running time of the script: ( 0 minutes 0.273 seconds)