Note
Click here to download the full example code
Customising element size and figure size
This example illustrates controlling sizing within an UpSet plot.
from matplotlib import pyplot as plt
from upsetplot import generate_counts, plot

example = generate_counts()
print(example)

plot(example)
plt.suptitle('Defaults')
plt.show()
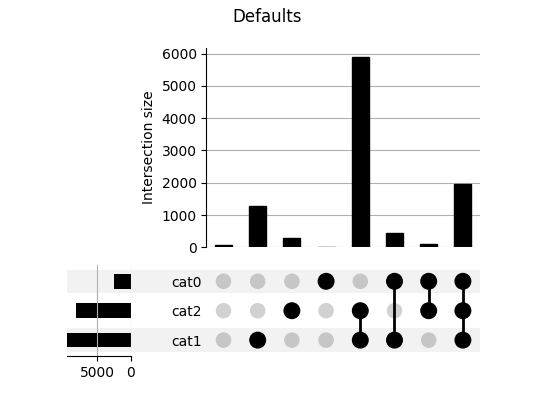
cat0   cat1   cat2
False  False  False      56
              True      283
       True   False    1279
              True     5882
True   False  False      24
              True       90
       True   False     429
              True     1957
Name: value, dtype: int64
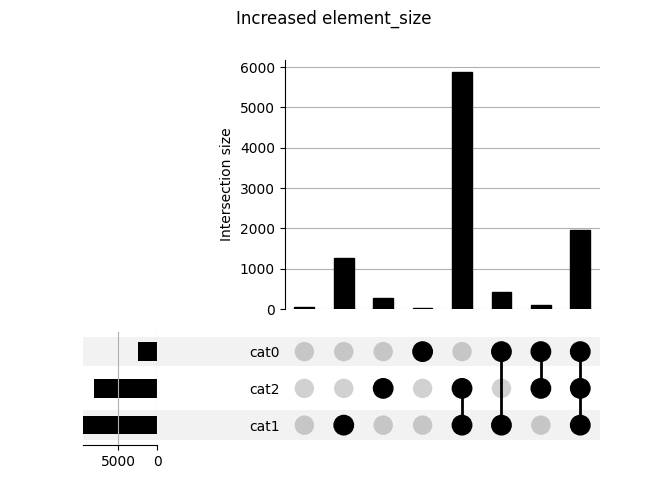
upsetplot uses a grid of square “elements” to display. Controlling the size of these elements affects all components of the plot.
plot(example, element_size=40)
plt.suptitle('Increased element_size')
plt.show()
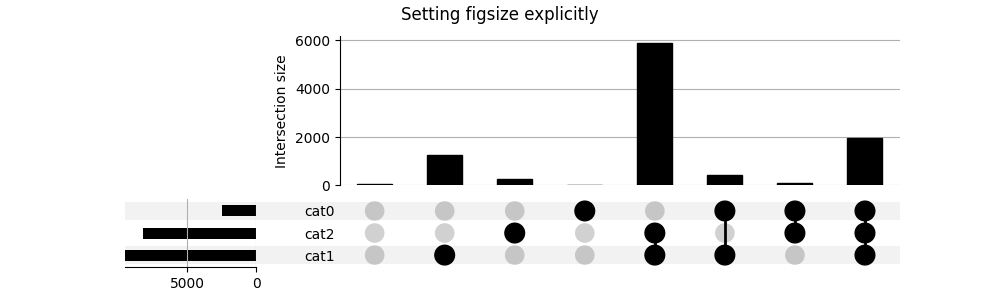
When setting figsize explicitly, you then need to pass the figure to
plot, and use element_size=None for optimal sizing.
fig = plt.figure(figsize=(10, 3))
plot(example, fig=fig, element_size=None)
plt.suptitle('Setting figsize explicitly')
plt.show()
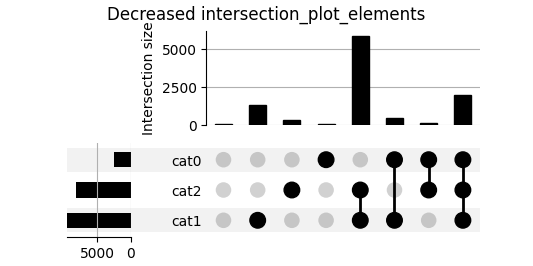
Components in the plot can be resized by indicating how many elements they should equate to.
plot(example, intersection_plot_elements=3)
plt.suptitle('Decreased intersection_plot_elements')
plt.show()
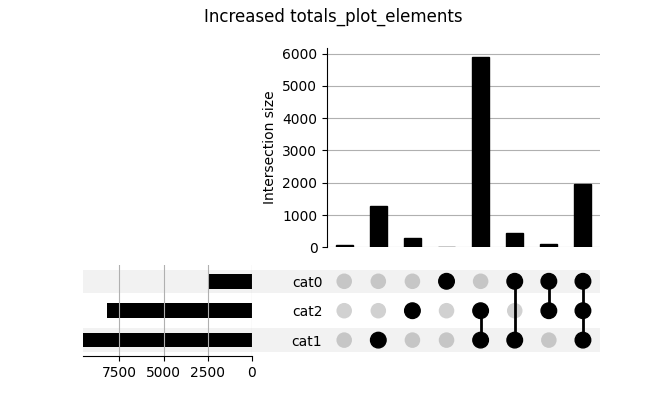
plot(example, totals_plot_elements=5)
plt.suptitle('Increased totals_plot_elements')
plt.show()
Total running time of the script: ( 0 minutes 0.990 seconds)