Note
Click here to download the full example code
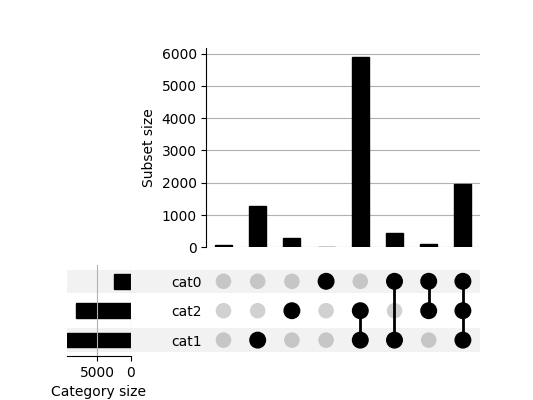
Design: Customizing axis labels
This example illustrates how the return value of the plot method can be used to customize aspects of the plot, such as axis labels, legend position, etc.
cat0   cat1   cat2
False  False  False      56
              True      283
       True   False    1279
              True     5882
True   False  False      24
              True       90
       True   False     429
              True     1957
Name: value, dtype: int64
plot_result = plot(example)
plot_result["intersections"].set_ylabel("Subset size")
plot_result["totals"].set_xlabel("Category size")
plt.show()
Total running time of the script: ( 0 minutes 0.308 seconds)