Note
Click here to download the full example code
Design: Customizing element size and figure size
This example illustrates controlling sizing within an UpSet plot.
from matplotlib import pyplot as plt

from upsetplot import generate_counts, plot

example = generate_counts()
print(example)

plot(example)
plt.suptitle("Defaults")
plt.show()
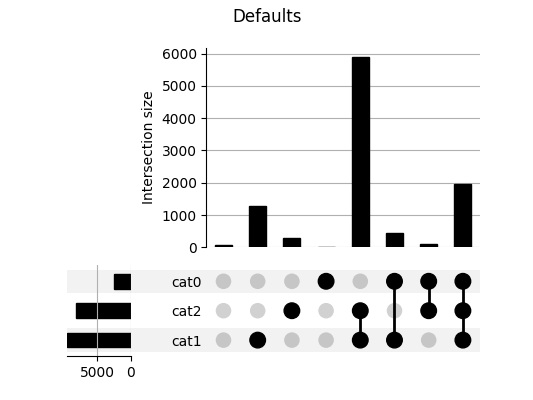
cat0   cat1   cat2
False  False  False      56
              True      283
       True   False    1279
              True     5882
True   False  False      24
              True       90
       True   False     429
              True     1957
Name: value, dtype: int64
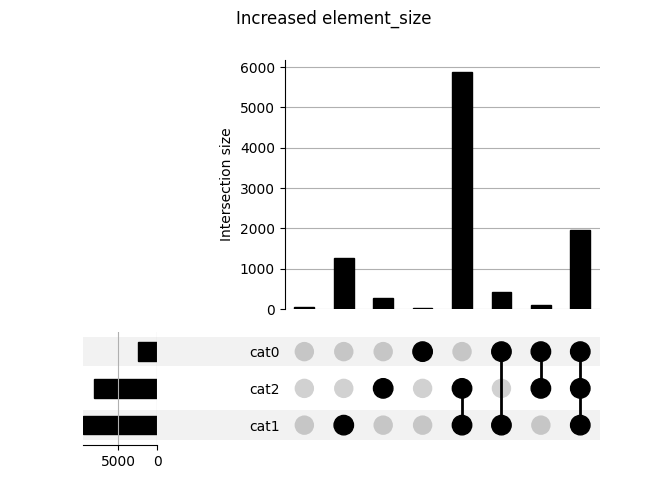
upsetplot uses a grid of square “elements” to display. Controlling the size of these elements affects all components of the plot.
plot(example, element_size=40)
plt.suptitle("Increased element_size")
plt.show()
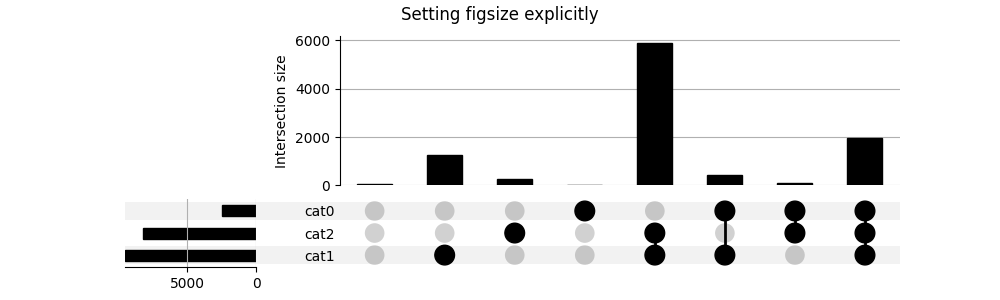
When setting figsize explicitly, you then need to pass the figure to
plot, and use element_size=None for optimal sizing.
fig = plt.figure(figsize=(10, 3))
plot(example, fig=fig, element_size=None)
plt.suptitle("Setting figsize explicitly")
plt.show()
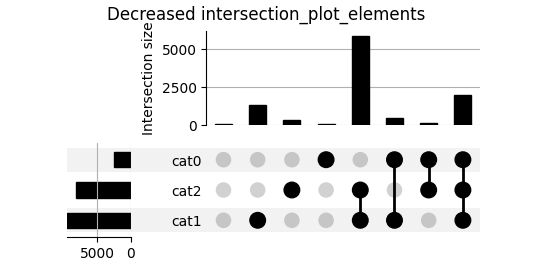
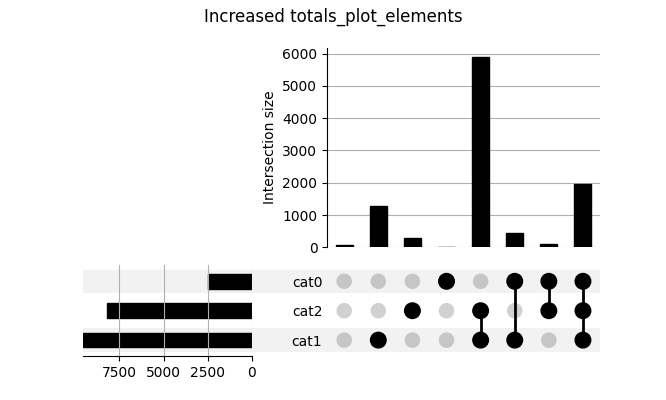
Components in the plot can be resized by indicating how many elements they should equate to.
plot(example, intersection_plot_elements=3)
plt.suptitle("Decreased intersection_plot_elements")
plt.show()
plot(example, totals_plot_elements=5)
plt.suptitle("Increased totals_plot_elements")
plt.show()
Total running time of the script: ( 0 minutes 1.495 seconds)