Note
Click here to download the full example code
Data Vis: Feature distribution in Diabetes
Explore above-average attributes in the Diabetes dataset (Efron et al, 2004).
Here we take some features correlated with disease progression, and look at the distribution of that disease progression value when each of these features is above average.
The most correlated features are:
- bmi body mass index
- bp average blood pressure
- s4 tch, total cholesterol / HDL
- s5 ltg, possibly log of serum triglycerides level
- s6 glu, blood sugar level
This kind of dataset analysis may not be a practical use of UpSet, but helps
to illustrate the UpSet.add_catplot() feature.
import pandas as pd
from matplotlib import pyplot as plt
from sklearn.datasets import load_diabetes

from upsetplot import UpSet

# Load the dataset into a DataFrame
diabetes = load_diabetes()
diabetes_df = pd.DataFrame(diabetes.data, columns=diabetes.feature_names)

# Get five features most correlated with median house value
correls = diabetes_df.corrwith(
    pd.Series(diabetes.target), method="spearman"
).sort_values()
top_features = correls.index[-5:]

# Get a binary indicator of whether each top feature is above average
diabetes_above_avg = diabetes_df > diabetes_df.median(axis=0)
diabetes_above_avg = diabetes_above_avg[top_features]
diabetes_above_avg = diabetes_above_avg.rename(columns=lambda x: x + ">")

# Make this indicator mask an index of diabetes_df
diabetes_df = pd.concat([diabetes_df, diabetes_above_avg], axis=1)
diabetes_df = diabetes_df.set_index(list(diabetes_above_avg.columns))

# Also give us access to the target (median house value)
diabetes_df = diabetes_df.assign(progression=diabetes.target)
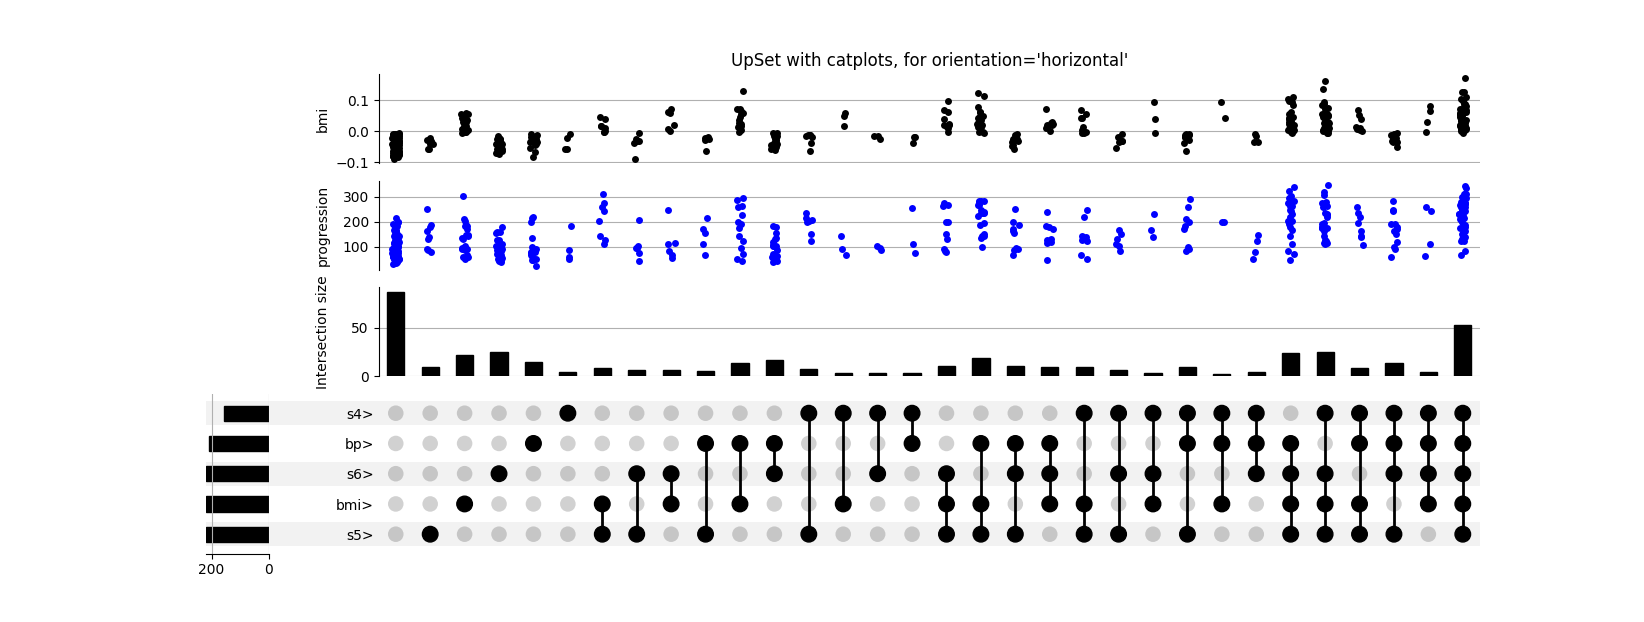
# UpSet plot it!
upset = UpSet(diabetes_df, subset_size="count", intersection_plot_elements=3)
upset.add_catplot(value="progression", kind="strip", color="blue")
print(diabetes_df)
upset.add_catplot(value="bmi", kind="strip", color="black")
upset.plot()
plt.title("UpSet with catplots, for orientation='horizontal'")
plt.show()
                                    age       sex  ...        s6  progression
s6>   bp>   s4>   bmi>  s5>                        ...
False True  False True  True   0.038076  0.050680  ... -0.017646        151.0
      False False False False -0.001882 -0.044642  ... -0.092204         75.0
                  True  True   0.085299  0.050680  ... -0.025930        141.0
            True  False True  -0.089063 -0.044642  ... -0.009362        206.0
      True  False False False  0.005383 -0.044642  ... -0.046641        135.0
...                                 ...       ...  ...       ...          ...
True  True  False True  True   0.041708  0.050680  ...  0.007207        178.0
      False True  False False -0.005515  0.050680  ...  0.044485        104.0
      True  False False False  0.041708  0.050680  ...  0.015491        132.0
False True  True  True  True  -0.045472 -0.044642  ... -0.025930        220.0
True  False False False False -0.045472 -0.044642  ...  0.003064         57.0

[442 rows x 11 columns]
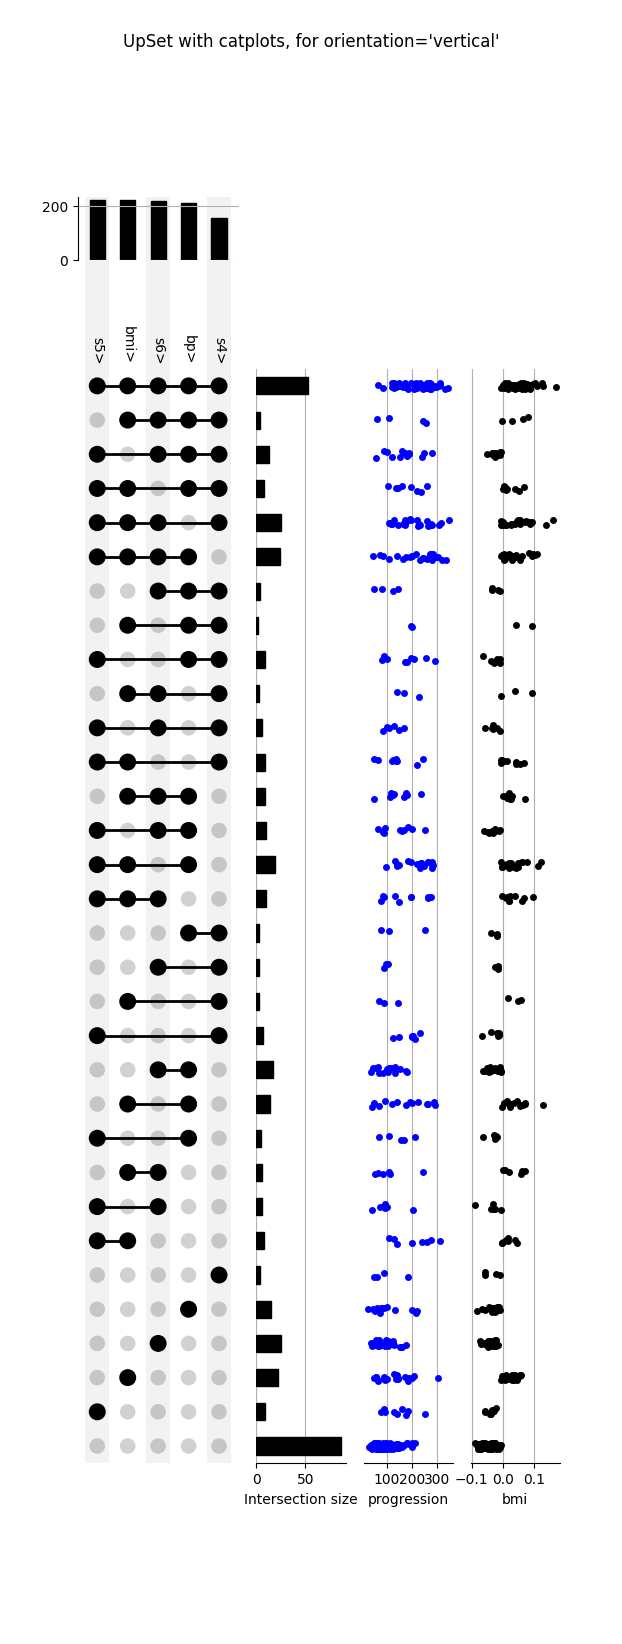
# And again in vertical orientation

upset = UpSet(
    diabetes_df,
    subset_size="count",
    intersection_plot_elements=3,
    orientation="vertical",
)
upset.add_catplot(value="progression", kind="strip", color="blue")
upset.add_catplot(value="bmi", kind="strip", color="black")
upset.plot()
plt.suptitle("UpSet with catplots, for orientation='vertical'")
plt.show()
Total running time of the script: ( 0 minutes 4.036 seconds)