Note
Click here to download the full example code
Basic: Examples with generated data
This example illustrates basic plotting functionality using generated data.
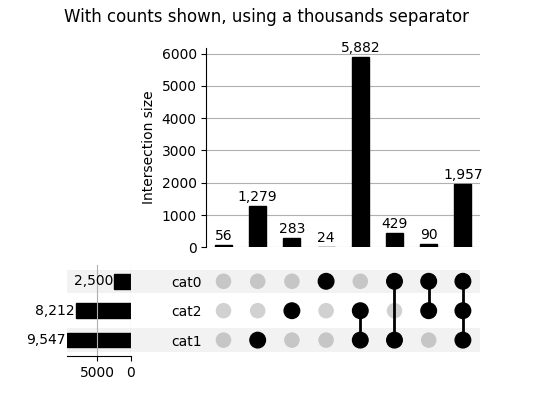
cat0   cat1   cat2
False  False  False      56
              True      283
       True   False    1279
              True     5882
True   False  False      24
              True       90
       True   False     429
              True     1957
Name: value, dtype: int64
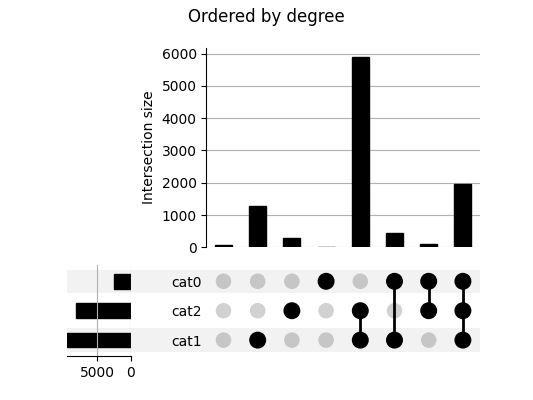
plot(example)
plt.suptitle("Ordered by degree")
plt.show()
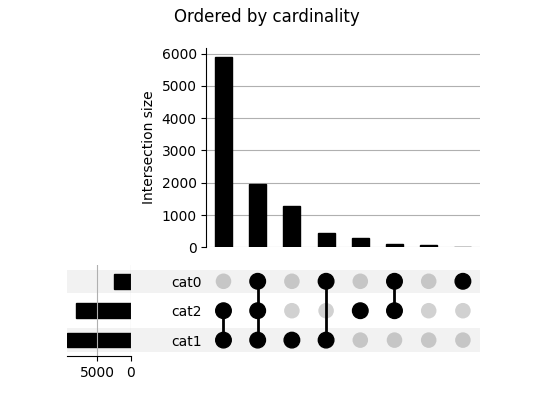
plot(example, sort_by="cardinality")
plt.suptitle("Ordered by cardinality")
plt.show()
plot(example, show_counts="{:,}")
plt.suptitle("With counts shown, using a thousands separator")
plt.show()
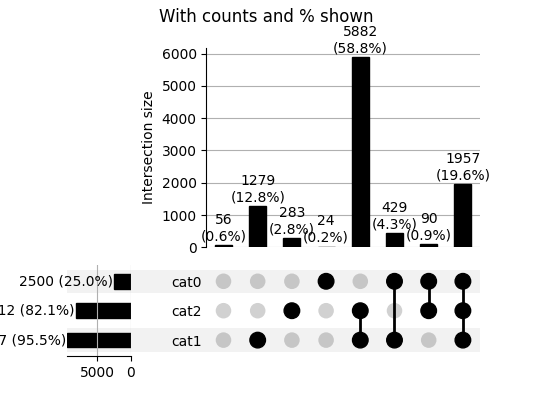
plot(example, show_counts="%d", show_percentages=True)
plt.suptitle("With counts and % shown")
plt.show()
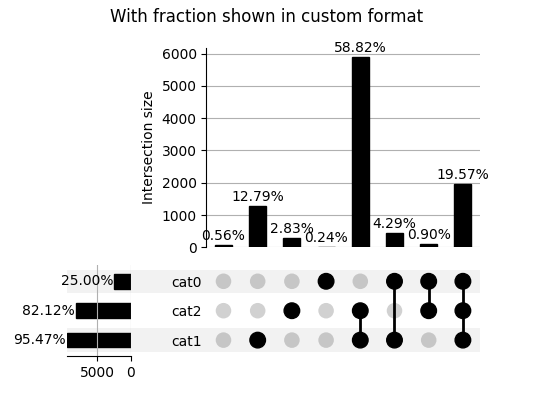
plot(example, show_percentages="{:.2%}")
plt.suptitle("With fraction shown in custom format")
plt.show()
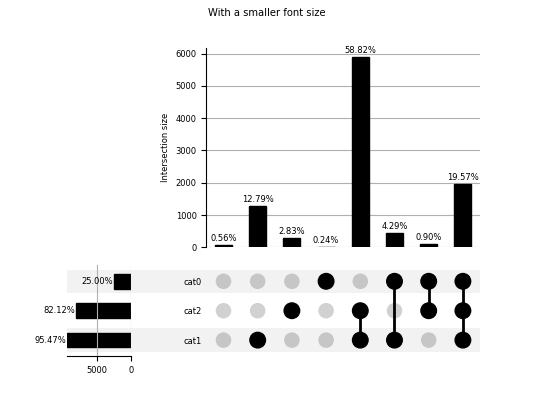
matplotlib.rcParams["font.size"] = 6
plot(example, show_percentages="{:.2%}")
plt.suptitle("With a smaller font size")
plt.show()
Total running time of the script: ( 0 minutes 1.363 seconds)