Note
Click here to download the full example code
Data Vis: Highlighting selected subsets
Demonstrates use of the style_subsets method to mark some subsets as
different.
from matplotlib import pyplot as plt

from upsetplot import UpSet, generate_counts

example = generate_counts()
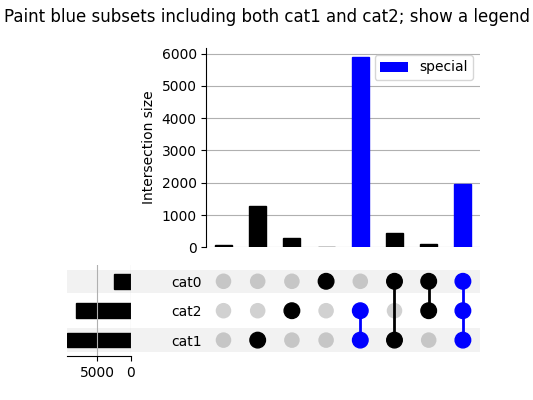
Subsets can be styled by the categories present in them, and a legend can be optionally generated.
upset = UpSet(example)
upset.style_subsets(present=["cat1", "cat2"], facecolor="blue", label="special")
upset.plot()
plt.suptitle("Paint blue subsets including both cat1 and cat2; show a legend")
plt.show()
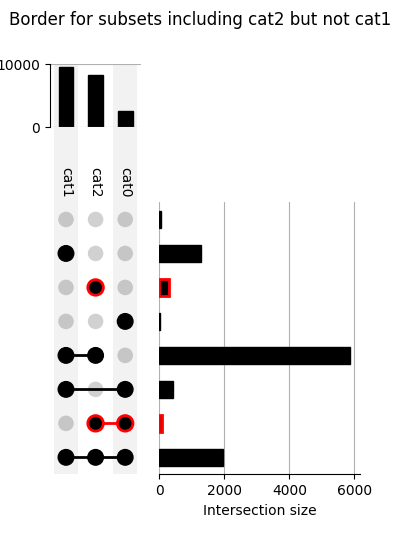
… or styling can be applied by the categories absent in a subset.
upset = UpSet(example, orientation="vertical")
upset.style_subsets(present="cat2", absent="cat1", edgecolor="red", linewidth=2)
upset.plot()
plt.suptitle("Border for subsets including cat2 but not cat1")
plt.show()
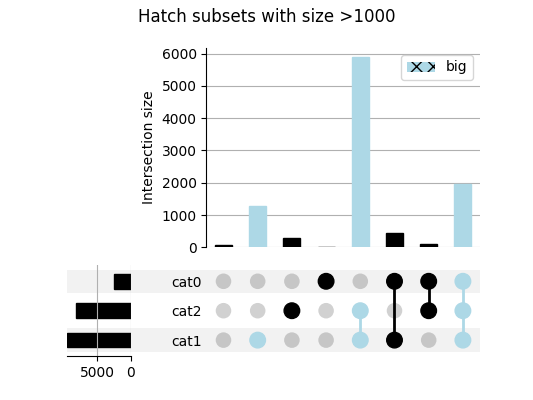
… or their size.
upset = UpSet(example)
upset.style_subsets(
    min_subset_size=1000, facecolor="lightblue", hatch="xx", label="big"
)
upset.plot()
plt.suptitle("Hatch subsets with size >1000")
plt.show()
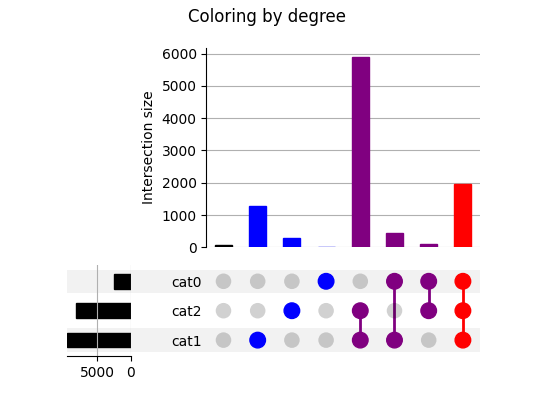
… or degree.
upset = UpSet(example)
upset.style_subsets(min_degree=1, facecolor="blue")
upset.style_subsets(min_degree=2, facecolor="purple")
upset.style_subsets(min_degree=3, facecolor="red")
upset.plot()
plt.suptitle("Coloring by degree")
plt.show()
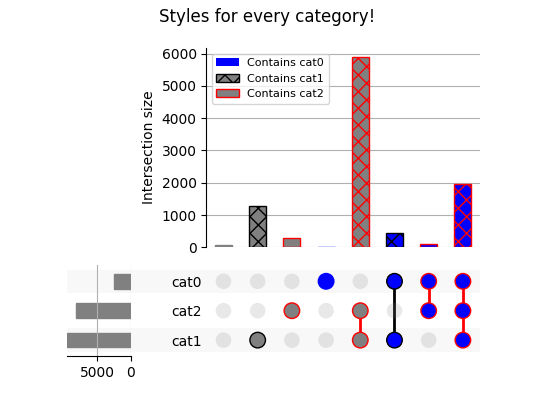
Multiple stylings can be applied with different criteria in the same plot.
upset = UpSet(example, facecolor="gray")
upset.style_subsets(present="cat0", label="Contains cat0", facecolor="blue")
upset.style_subsets(
    present="cat1", label="Contains cat1", hatch="xx", edgecolor="black"
)
upset.style_subsets(present="cat2", label="Contains cat2", edgecolor="red")

# reduce legend size:
params = {"legend.fontsize": 8}
with plt.rc_context(params):
    upset.plot()
plt.suptitle("Styles for every category!")
plt.show()
Total running time of the script: ( 0 minutes 1.092 seconds)