Note
Click here to download the full example code
Data Vis: Highlighting selected categories
Demonstrates use of the style_categories method to mark some
categories differently.
from matplotlib import pyplot as plt

from upsetplot import UpSet, generate_counts

example = generate_counts()
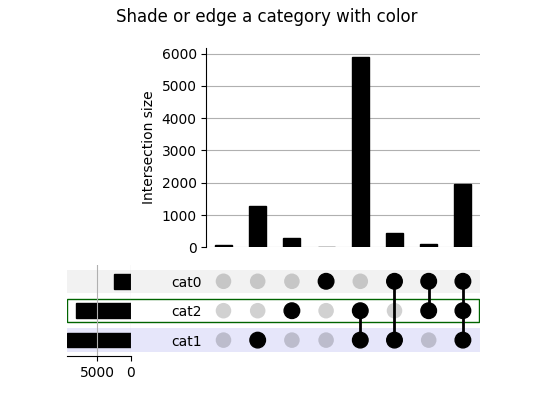
Categories can be shaded by name with the shading_ parameters.
upset = UpSet(example)
upset.style_categories("cat2", shading_edgecolor="darkgreen", shading_linewidth=1)
upset.style_categories(
    "cat1",
    shading_facecolor="lavender",
)
upset.plot()
plt.suptitle("Shade or edge a category with color")
plt.show()
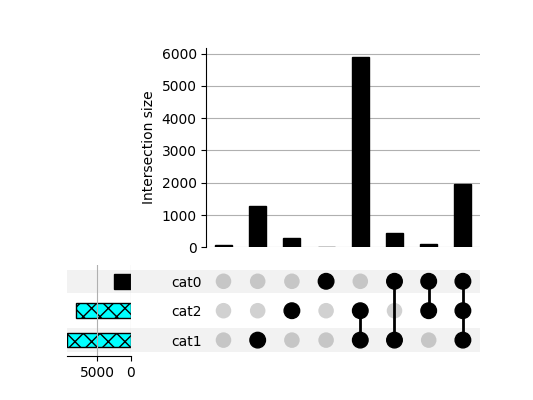
Category total bars can be styled with the bar_ parameters.
You can also specify categories using a list of names.
upset = UpSet(example)
upset.style_categories(
    ["cat2", "cat1"], bar_facecolor="aqua", bar_hatch="xx", bar_edgecolor="black"
)
upset.plot()
plt.suptitle("")
plt.show()
Total running time of the script: ( 0 minutes 0.413 seconds)